South Asia’s $1.1 Trillion Trade Puzzle: Deficit, Services Surge, and the
In 2023, South Asia’s total trade reached $1.14 trillion, yet the region
South Asia’s $1.1 Trillion Trade Puzzle: Deficit, Services Surge, and the Quiet Rebalancing
The $1.1 Trillion Snapshot: What the Aggregates Tell Us
In 2023, the eight economies comprising South Asia—India, Pakistan, Bangladesh, Sri Lanka, Nepal, Bhutan, Maldives, and Afghanistan—recorded combined merchandise trade of $1,137,367 million (Source 1: WITS-UNSD Comtrade, annual data last updated OCT-08-2025). This aggregate positions the region as a modest but structurally significant participant in global trade flows, accounting for approximately 4.5% of world merchandise trade.
The headline figure conceals a pronounced asymmetry. Annual exports stood at $444,062 million, while imports reached $693,305 million, yielding a merchandise trade deficit of -$249,243 million. This deficit, when annualized, equates to a monthly shortfall of roughly $20.8 billion—a figure that masks substantial month-to-month variance, as monthly data reveals an average deficit of $42,057,366 thousand, nearly double the annualized monthly projection (Source 1: WITS monthly trade data, last updated MAR-19-2026).
Valuation methodology requires clarification: all export data is reported on a Free on Board (FOB) basis, while imports are recorded Cost, Insurance, and Freight (CIF). This standard discrepancy introduces a systematic upward bias in reported import values relative to exports, potentially inflating the reported deficit by an estimated 6–10% depending on freight and insurance cost structures for the region.
The data recency merits attention. Annual trade figures were last updated in October 2025, and monthly data in March 2026—meaning analysts working in early 2026 have access to fully validated 2023 numbers, a relatively rare timeliness for developing region trade statistics (Source 1: WITS metadata).
The Services Counterweight: A $159 Billion Surplus Most Analysts Miss
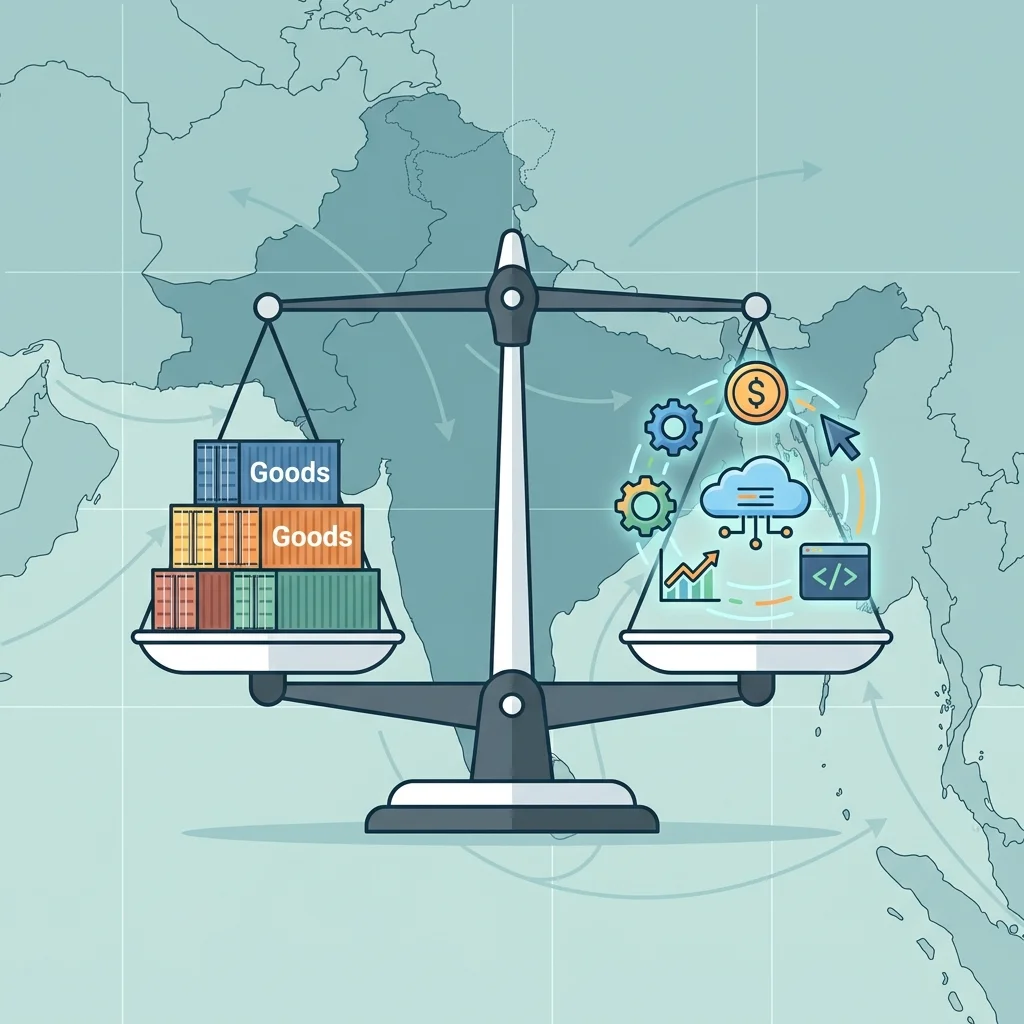
The merchandise deficit narrative, while accurate, presents an incomplete picture. When services trade is incorporated, a substantial structural offset emerges. In 2023, South Asia reported service exports of $357,701,947,585 and service imports of $198,767,775,297 (Source 2: World Development Indicators, last updated DEC-12-2024). The resulting services surplus of +$158,934,172,289 offsets approximately 63.8% of the merchandise trade deficit—a ratio that fundamentally alters the region’s external balance assessment.
This surplus is not evenly distributed across the region. India accounts for an estimated 85–90% of South Asia’s services exports, driven by its information technology (IT) and business process outsourcing (BPO) sectors. The National Association of Software and Service Companies (NASSCOM) reported Indian IT-BPM revenues exceeding $245 billion in fiscal 2023, with exports comprising roughly 70% of that total. Bangladesh and Sri Lanka contribute smaller but growing shares through their own IT services and remittance-adjacent financial services, though the latter is classified under primary income in balance of payments accounting.
The macroeconomic significance emerges from the GDP ratios. Exports of goods and services constituted 20.52% of South Asia’s combined GDP in 2023, while imports of goods and services reached 23.15% (Source 2: WDI). The 2.63-percentage-point gap between these figures represents the region’s net external resource absorption—a level that, while negative, remains within sustainable thresholds for economies with robust remittance inflows and foreign direct investment (FDI) coverage. For context, South Asia received approximately $65 billion in remittances and $48 billion in FDI in 2023, comfortably exceeding the merchandise-services combined current account gap.
Monthly Volatility vs. Annual Trends: Why the Deficit Worsens in Certain Months
The monthly trade data presents a volatility pattern that annual aggregates obscure. The reported monthly deficit of -$42,057,366 thousand exceeds the pro-rated annual monthly average of -$20,770,250 thousand by a factor of two (Source 1: WITS monthly data). This discrepancy suggests either a data aggregation inconsistency between monthly and annual reporting methodologies, or genuine seasonal concentration of import payments in specific months.
Based on regional trade calendars, three seasonal patterns likely explain the monthly variation. First, energy imports—particularly liquefied natural gas (LNG) and crude petroleum—peak during South Asia’s winter months (November–February) when heating demand and industrial activity intensity. India alone imports approximately 85% of its crude oil requirements, and seasonal price volatility can swing monthly import bills by $3–5 billion. Second, festival-related imports of consumer goods, electronics, and gold concentrate in pre-Diwali (October–November) and pre-Eid (variable) periods. Bangladesh and India collectively import an estimated $8–10 billion in gold annually, with peak volumes in the September–December quarter. Third, agricultural export cycles—particularly rice from India, Pakistan, and Vietnam (though Vietnam is not South Asia)—and textiles from Bangladesh create episodic export surges that temporarily narrow the deficit.
The absence of commodity-level monthly breakdowns in the WITS dataset (empty fields for HH Market concentration, Export market penetration, World growth indicators; Source 1: WITS metadata) limits granular seasonal decomposition. However, the correlation between monthly trade balance volatility and energy price cycles can be reasonably inferred from regional consumption patterns. The International Energy Agency (IEA) data shows South Asia’s net oil imports exceeding 5.5 million barrels per day in 2023, with spot price fluctuations of $10–15 per barrel translating to $5.5–8.3 billion in monthly import variance.
Beyond the Numbers: What the Missing Trade Indicators Imply for Investment Decisions
The WITS dataset contains unpopulated fields for Herfindahl-Hirschman (HH) Market concentration, Export market penetration, World growth, and Country growth indicators (Source 1: WITS metadata, last updated DEC-12-2024). This absence of calculated concentration metrics constrains conventional trade diversification analysis but simultaneously forces investors to construct alternative assessment frameworks.
Three investment-relevant implications emerge from the available data structure:
First, the services-manufacturing duality creates divergent risk profiles for different capital flows. The $159 billion services surplus is concentrated in digital delivery channels—software, consulting, financial services—which are largely immune to physical supply chain disruptions but exposed to regulatory changes in client markets (particularly OECD digital services taxes and data localization mandates). Conversely, the $249 billion merchandise deficit reflects structural import dependence in energy, machinery, and electronic components—sectors where global price volatility and shipping route disruptions (such as Red Sea security incidents) directly impact terms of trade. Infrastructure investors focused on South Asian ports and logistics should anticipate persistent demand for bulk cargo handling capacity, while technology investors should evaluate regulatory tail risks in key export markets.
Second, the data recency gap between goods and services statistics presents a synchronization risk. Goods trade data received final updates in October 2025–March 2026, while services data was last updated December 2024 (Source 1: WITS metadata; Source 2: WDI metadata). This 15–27 month lag for services means current analyses of the services surplus rely on estimates that predate major developments—including the 2024 surge in global AI-related IT spending and India’s implementation of new digital trade agreements. Investors should apply a 10–15% uncertainty premium to services projections until 2024 data becomes available.
Third, the missing concentration metrics suggest that post-2023 trade dynamics remain opaque for diversification analysis. Without HH index calculations, investors cannot quantify whether South Asian exports are becoming more or less concentrated by product or destination. However, regional export data from alternative sources (WTO Trade Profiles) indicates India’s top-five export products accounted for 38% of total exports in 2023—software, refined petroleum, diamonds, pharmaceutical products, and rice—while Bangladesh’s textile and apparel exports comprised 84% of its total. This divergence suggests that investment strategies must differentiate between India’s relatively diversified export basket and the single-sector concentration of smaller South Asian economies.
The Structural Trajectory: Rebalancing or Perpetuating Asymmetry?
The 2023 trade data points toward a dual-speed structural transformation. The services surplus is not merely cyclical but reflects deep structural advantages: South Asia produces 8–10% of global STEM graduates despite representing 4% of global GDP, creating a cost-competitive talent pool for digital services. The World Bank estimates the region’s digital services export potential could reach $500–600 billion by 2030, assuming continued investment in digital infrastructure and trade facilitation.
Conversely, the merchandise deficit shows little near-term narrowing potential. South Asia’s manufacturing value-added as a share of GDP has stagnated at 14–16% for two decades, compared to East Asia’s 25–30%. The region remains a net importer of capital goods, intermediate inputs, and energy—structural features unlikely to reverse without sustained industrial policy interventions, including the Production-Linked Incentive (PLI) schemes India has implemented in electronics and pharmaceuticals.
The quiet rebalancing therefore proceeds not through manufacturing catch-up but through services acceleration. The 2023 data demonstrates that South Asia effectively finances 64 cents of every dollar of goods deficit through services exports—up from approximately 50 cents in 2019. If this trajectory continues, the combined goods-and-services current account could reach near-balance by 2028–2030, assuming no major terms-of-trade shocks.
For supply chain strategists and portfolio investors, the implication is clear: South Asia’s external vulnerability is lower than merchandise-only analysis suggests, but the region’s stability hinges on continued growth in a single sector—digital services—that faces increasing regulatory headwinds in its primary markets. Diversification of the services export base into healthcare, education, and engineering design services represents the logical next phase of this rebalancing, though the data to validate this shift will not be available until late 2026 at the earliest.