Asia''s Greenfield FDI Boom and the Coming Correction: Supply Chain Realities
In 2024, Asia recorded its highest greenfield FDI project numbers in five
Asia's Greenfield FDI Boom and the Coming Correction: Supply Chain Realities Behind the 2024 Record
The 2024 Peak: Asia's Record Year in Context
Global greenfield foreign direct investment (FDI) reached a milestone in 2024, with more than 17,000 projects announced worldwide (Source 1: FT Locations Primary Data). Asia captured 22% of these projects, placing it second only to Western Europe in total project count. The headline figure masks a significant divergence: Asia recorded over 33% growth in project activity compared to the 2019-2023 average, while Western Europe experienced a 12% decline over the same benchmark (Source 1: FT Locations Primary Data).
The contraction in COVID-era activity establishes the baseline for understanding this recovery. In 2020, pandemic disruptions reduced greenfield project numbers in Asia by 44% (Source 1: FT Locations Primary Data). The region subsequently surpassed pre-pandemic levels by 2023, registering 5% year-over-year growth in 2024. Capital investment in Asia reached nearly $400 billion—30% of the global share, a five-year high. However, when adjusted for inflation, this capital figure remains below pre-COVID nominal peaks (Source 1: FT Locations Primary Data), indicating that project counts have recovered faster than average deal sizes in real terms.
Image suggestion: Bar chart comparing Asia vs Western Europe greenfield project counts 2019-2024, with a dotted line showing pre-COVID baseline.
The Great Shift: India Rises, China Slows, Vietnam Consolidates
India emerged as the third-largest recipient of greenfield projects globally in 2024, driven by expansions in electronics manufacturing, renewable energy infrastructure, and business services (Source 1: FT Locations Primary Data). This represents a structural repositioning of supply chains rather than cyclical demand. China, by contrast, posted a 10% decline in project growth over the same period, reflecting regulatory tightening in strategic sectors and erosion of cost competitiveness relative to Southeast Asian alternatives (Source 1: FT Locations Primary Data).
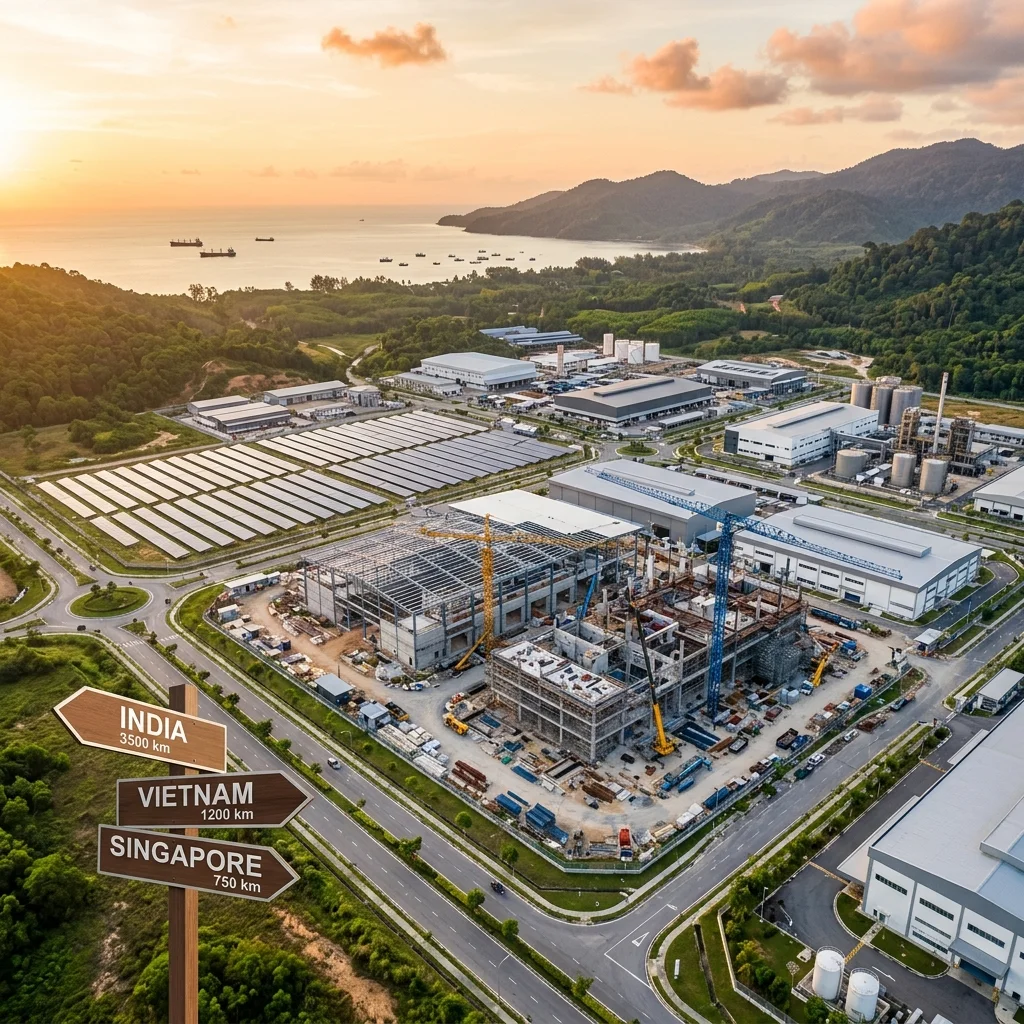
Vietnam, India, and Singapore collectively attracted nearly 40% of all intra-Asian FDI projects (Source 1: FT Locations Primary Data), forming what industry analysts describe as a new "factory corridor" spanning South and Southeast Asia. The underlying economic logic centers on the electric vehicle (EV) battery supply chain. Companies such as Sunwoda have announced major expansions in India and Southeast Asia, relocating production capacity that previously would have been sited in mainland China (Source 1: FT Locations Primary Data). This pattern reflects a deliberate strategy among original equipment manufacturers to diversify battery sourcing away from single-country concentration, driven by both tariff considerations and supply chain resilience mandates.
Image suggestion: Map of Asia highlighting FDI project density in India, Vietnam, and Singapore with flow lines from US and UAE.
Intra-Asian Investment Surge: The Region Invests in Itself
Asia accounted for 21% of global outbound greenfield FDI projects in 2024, a share that has grown steadily since 2020 (Source 1: FT Locations Primary Data). More than one-third of Asian outbound FDI remained within the region—a record share for intra-regional investment flows. China recently overtook Japan as the top source of outbound FDI from Asia, while the United States and the United Arab Emirates emerged as the primary external destinations for Asian outbound capital (Source 1: FT Locations Primary Data).
The motivations behind these flows reveal a structural transformation. Projects citing "proximity to customers" as the primary investment motivator increased by 50% in 2024 compared to earlier benchmarks (Source 1: FT Locations Primary Data). This metric indicates that supply chain regionalization—specifically nearshoring within Asia—is replacing the previous model of exporting final assembly to distant consumer markets. The corollary is that Asian firms are increasingly treating their own region as an integrated production and consumption ecosystem, rather than exclusively as an export platform for Western demand.
Image suggestion: Pie chart showing outbound FDI distribution: intra-Asia (34%), US+UAE (28%), other (38%).
Sector Spotlight: Why Asia Gets 2.5x Its Fair Share of Semiconductor FDI
Asia receives 2.5 times its proportional global share of greenfield FDI in the semiconductor subsector (Source 1: FT Locations Primary Data). This asymmetry is not accidental. The concentration reflects three converging drivers: surging chip demand from EV production, artificial intelligence infrastructure buildout, and consumer electronics replacement cycles. Governments in India, Malaysia, Vietnam, and Indonesia have implemented targeted incentive programs—including capital subsidies, tax holidays, and land concessions—to capture fabrication and assembly investments that might otherwise have located in the United States or Europe (Source 1: FT Locations Primary Data).
Semiconductor FDI functions as an anchor investment for broader electronics supply chains. Countries that secure chip fabrication facilities subsequently attract battery manufacturing, component assembly, and final product testing investments. This multiplier effect explains why Vietnam and Malaysia, despite smaller domestic markets than China or India, have become disproportionate beneficiaries of high-value FDI. The semiconductor-to-battery linkage creates path dependency: once a country hosts a major fabrication facility, the marginal cost for adjacent industries to co-locate declines significantly.
Image suggestion: Infographic showing semiconductor FDI as the anchor for EV battery and assembly investments in India, Malaysia, and Vietnam.
Q1 2025 Warning Signals: A Cyclical Correction or Structural Reset?
Provisional data from the first quarter of 2025 signals a potential 10-15% decline in greenfield FDI project activity across Asia (Source 1: FT Locations Primary Data). Glenn Barklie, chief economist at FT Locations, has noted that the 2024 peak likely represented both a post-COVID catch-up effect and a pre-election investment surge in certain markets. The Q1 2025 numbers, while preliminary, suggest that some of the 2024 projects were pulled forward in anticipation of trade policy changes and interest rate volatility.
The correction appears uneven across sectors. Semiconductor and EV battery projects remain robust, consistent with multi-year construction timelines that are less sensitive to quarterly economic fluctuations. Consumer goods and light manufacturing projects, which have shorter decision cycles, show more pronounced declines. India and Vietnam continue to attract new project announcements, while China's share of new capital commitments has continued to edge downward (Source 1: FT Locations Provisional Data).
The Regionalization Thesis: Evidence and Limits
The 50% increase in "proximity to customers" as a project motivator represents the strongest quantitative evidence for supply chain regionalization in Asia. However, this trend has limits. Intra-Asian investment remains heavily concentrated in three economies—Vietnam, India, and Singapore—which together account for nearly 40% of all regional investment flows (Source 1: FT Locations Primary Data). Central Asian economies such as Uzbekistan and Kazakhstan have seen increased project inquiries but remain marginal recipients of actual capital deployment.
The US and UAE's position as the top destinations for Asian outbound FDI complicates the narrative of a purely regionalized supply chain. Asian firms are simultaneously building capacity within Asia and establishing beachheads in Western markets, suggesting a bifurcated strategy: nearshoring for cost-sensitive production, and direct presence in major consumption markets for brand and regulatory access. This dual-track approach is likely to persist, meaning that "Asia for Asia" will coexist with "Asia for the world" rather than replacing it entirely.
Outlook: Three Scenarios for 2025-2026
Based on the structural drivers identified above, three scenarios emerge for Asia's greenfield FDI trajectory:
Scenario A (Stabilization, 55% probability): The Q1 2025 correction proves transitory, with full-year project counts settling 5-8% below 2024 levels. Semiconductor and EV battery investments maintain momentum, offsetting declines in consumer goods. India and Vietnam continue to gain share at China's expense. Intra-Asian investment stabilizes at approximately one-third of Asian outbound flows.
Scenario B (Structural Decline, 25% probability): The 2024 peak was a cyclical high-water mark driven by post-COVID catch-up and policy arbitrage. Project counts decline 15-20% in 2025 and remain flat in 2026. Capital investment in real terms falls below pre-COVID levels. Semiconductor FDI growth decelerates as fabrication overcapacity emerges in certain subsectors.
Scenario C (Resumption of Growth, 20% probability): Interest rate normalization and resolved trade policy uncertainty trigger a second wave of investment in H2 2025. Full-year project counts exceed 2024 levels by 5-10%. India emerges as the second-largest global recipient of greenfield FDI behind the United States. Central Asian economies begin capturing meaningful shares of nearshoring flows.
The balance of evidence supports Scenario A. The structural drivers—supply chain diversification away from China, semiconductor demand growth, and EV battery capacity expansion—remain intact. The Q1 2025 data likely reflects a normalization after the exceptional concentration of decision-making in 2024, rather than a reversal of the regionalization trend. However, investors should monitor two variables: the trajectory of global interest rates, which affects project financing costs, and trade policy announcements from major consuming economies, which can rapidly reorder supply chain calculations.