Beyond the Levels: The Macro Forces Driving Nifty''s 24,600 Target and 23,700
While the Nifty's technical setup points to a potential upside target of
Beyond the Levels: The Macro Forces Driving Nifty's 24,600 Target and 23,700 Support
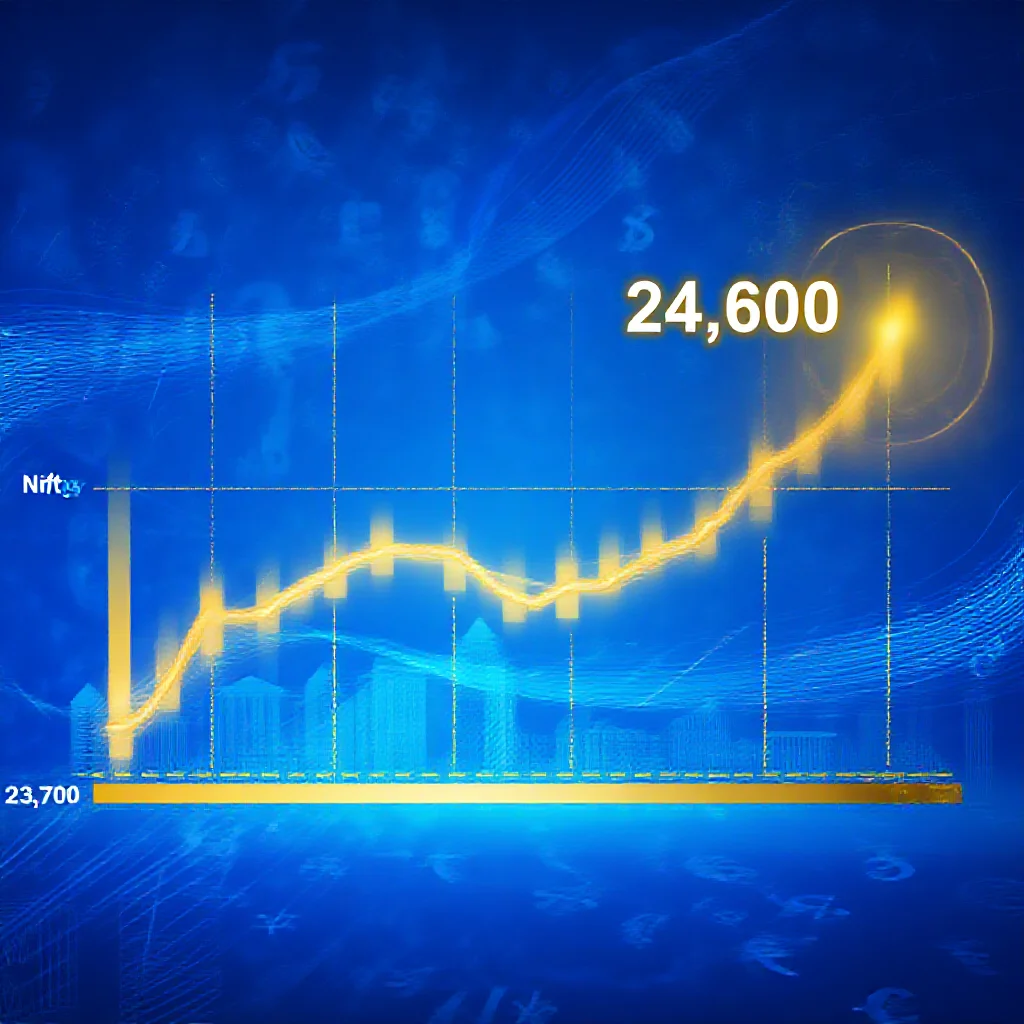
While the Nifty's technical setup points to a potential upside target of 24,500–24,600 with key support at 23,700, these levels are not arbitrary. This analysis moves beyond simple chart reading to explore the underlying macroeconomic and institutional drivers shaping this range. We examine how global liquidity flows, domestic policy pivots, and the structural shift in market participation are creating a new equilibrium. The article investigates why 23,700 has emerged as a critical support—a level representing a confluence of institutional cost bases—and what fundamental catalysts could propel the index toward the 24,600 target, offering a deeper narrative for the numbers on the screen.
Decoding the Digits: What 24,600 and 23,700 Really Represent
The technical levels of 24,600 and 23,700 function as more than psychological round numbers. They represent quantifiable zones of market memory and algorithmic interest. The 23,700 level establishes its technical credibility as a confluence zone, aligning closely with the dynamic support offered by the 50-day and 100-day simple moving averages. This level also corresponds to the upper boundary of a significant consolidation range observed in April-May 2024, a region where previous resistance has now transformed into support. A sustained hold above 23,700 confirms the breakout's validity and reinforces the bullish structure.
Conversely, the 24,500-24,600 band is identified as a measured move target, derived from the amplitude of the prior consolidation phase projected upward from the breakout point. This zone also coincides with the extension of the index's long-term ascending channel and represents the next logical resistance area following the achievement of new all-time highs. The convergence of pattern-based projections and channel resistance at this band increases its significance as a potential profit-taking zone for institutional algorithms.
The Macro Engine: Global and Domestic Catalysts for the Range
The immediate price action is validated by a "Fast Analysis" of recent triggers. Net Foreign Institutional Investor (FII) flows have turned positive in sync with the index's rebound from the 23,700 region, while Domestic Institutional Investor (DII) buying has provided consistent counter-balance during periods of FII selling. Concurrently, a stable-to-dovish stance from the Reserve Bank of India (RBI), focusing on liquidity management, has alleviated domestic rate fears. The India VIX, a measure of market volatility, has remained subdued, indicating a lack of panic that supports range-bound consolidation.
The "Slow Analysis" reveals more powerful structural shifts. India's inclusion in global bond indices is catalyzing predictable, multi-billion-dollar debt inflows, strengthening the rupee and creating a favorable liquidity backdrop for equities. More fundamentally, the systematic investment plan (SIP) flow into equity mutual funds, now exceeding ₹20,000 crore monthly, has created a durable, non-discretionary support base for the market. This domestic liquidity is facilitating a sectoral rotation from historically expensive segments into financials, industrials, and capital goods, which carry heavier weight in the Nifty, providing a fundamental underpinning for the index's ascent.
The Unseen Battle: Institutional Positioning vs. Market Structure
A critical viewpoint often missed in technical analysis is that the 23,700 support level likely approximates the aggregate volume-weighted average price for large institutional and passive ETF holdings accumulated over the previous quarter. A decisive break below this level would not only breach technical indicators but would also push a significant portion of institutional capital into an unrealized loss, potentially triggering automated risk-off protocols and systematic de-leveraging.
This institutional reality is mirrored and amplified in the derivatives market. Analysis of options data shows a pronounced concentration of Open Interest at the 23,700 strike for Put options and the 24,600 strike for Call options. This creates a "max pain" zone that can magnetize price action. The elevated Put-Call Ratio at these support levels indicates dealers are short puts; a break below support would force them to hedge by selling futures, potentially accelerating a decline. Thus, the options market reinforces these technical levels, creating a self-fulfilling prophecy anchored in dealer gamma positioning.
Risk Scenario: When the Support Narrative Fails
The 23,700 support thesis is contingent on the continuation of current macro conditions. It would be invalidated by a material shift in fundamental drivers. The primary risk is a sharp global risk-off event, triggered by a resurgence in geopolitical conflict or an unexpected inflationary surge in developed markets leading to delayed or fewer rate cuts. This could precipitate a sustained FII exodus overwhelming domestic inflows. Domestically, signs of fiscal stress, a significant deviation from the fiscal consolidation path, or a deterioration in corporate earnings growth would undermine the fundamental rationale for the current valuation support.
Should a break below 23,700 occur on a closing basis with high volume, the next critical support levels would be projected at the 200-day moving average near 23,000 and the major psychological level of 22,500. Early warning signs to monitor include a persistent rise in the India VIX above 18, a reversal in monthly SIP flow trends, and consecutive months of strong FII selling in both equity and debt markets. The stability of the 23,700-24,600 range, therefore, is less a chart pattern and more a real-time reflection of the balance between entrenched domestic liquidity and the fickle nature of global capital.