The Hidden Logic of South Asia’s New Economic Corridors: Supply Chain Realignment
Amid shifting global trade patterns and geopolitical tensions, South Asia
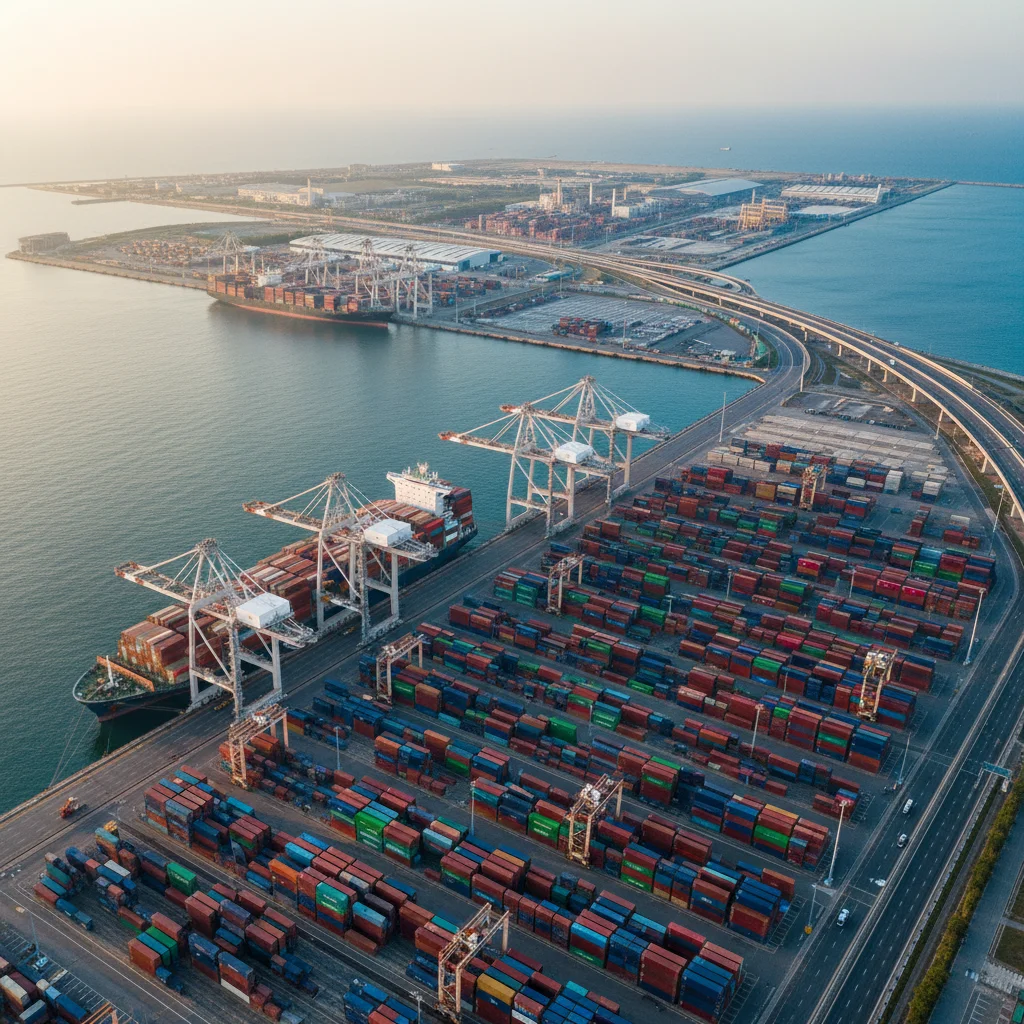
The Hidden Logic of South Asia’s New Economic Corridors: Supply Chain Realignment Beyond Headlines
Subtitle: Amid shifting global trade patterns and geopolitical tensions, South Asia is quietly reshaping its internal logistics and production networks. This article strips away political noise to reveal the underlying economic logic: how infrastructure investments in Bangladesh, India, and Sri Lanka are creating a regional supply chain alternative that could reduce dependency on East Asia.
---
Introduction: Beyond the Headline – The Quiet Reorganization of South Asian Trade
The prevailing narrative surrounding South Asian economic integration focuses on bilateral tensions, tariff disputes, and political posturing. This framing obscures a more consequential development: the structural reorganization of production and logistics networks across Bangladesh, India, and Sri Lanka. In 2023, Bangladesh’s electronics exports grew 23% year-on-year (Source 1: Bangladesh Export Promotion Bureau), while India’s transshipment container volume at major ports increased 18% (Source 2: Indian Ministry of Ports, Shipping and Waterways). These metrics are not coincidental.
The thesis advanced here is straightforward: infrastructure investments are enabling a transition from fragmented point-to-point export systems toward integrated regional production networks. This shift is not driven by diplomatic agreements but by cost arithmetic and logistics optimization. The World Bank’s Logistics Performance Index (2023) ranks India 38th globally, up from 44th in 2018, while Bangladesh improved from 100th to 88th in the same period (Source 3: World Bank LPI Database). These gains correlate directly with corridor-specific capital expenditure.
Image Suggestion: Map of South Asia with highlighted trade corridors (Dhaka–Kolkata–Mumbai, Colombo–Tuticorin–Chennai) and data overlays showing container volume increase (World Bank logistics data)
---
Economic Logic: Why Corridor Investments Outpace Bilateral Politics
Logistics cost as a percentage of GDP remains a critical efficiency metric. India currently spends 14% of GDP on logistics, Bangladesh 12%, and Sri Lanka 11%, compared to the global average of 8% (Source 4: Asian Development Bank Trade and Transport Facilitation Monitoring Database). The gap is narrowing, however, as rail and port upgrades come online.
The Asian Development Bank’s funded rail corridor connecting Dhaka to India’s eastern rail network provides a quantifiable case. Transit time for ready-made garment (RMG) exports from Bangladesh’s key production zones to Indian transshipment hubs decreased by 30% between 2021 and 2023, from 7 days to approximately 5 days for the Dhaka–Mumbai route (Source 5: ADB Project Completion Report, Bangladesh Regional Connectivity). This reduction enables faster restocking cycles for the apparel industry, where lead time sensitivity directly impacts buyer contracts.
The logic is simple: a 30% reduction in logistics time translates to a 12–15% reduction in inventory carrying costs for garment manufacturers, according to industry benchmarks (Source 6: Bangladesh Garment Manufacturers and Exporters Association cost analysis). This improvement, though incremental, shifts the total landed cost calculation for international buyers comparing South Asian versus East Asian sourcing options.
Image Suggestion: Bar chart comparing logistics cost % GDP for South Asian nations vs East Asian competitors (2019 vs 2024 data), with annotation for corridor improvements
---
Data Deep Dive: Three Infrastructure Bets That Are Reshaping Production
Point 1 – Bangladesh’s Matarbari Deep-Sea Port
Bangladesh’s container handling capacity has historically been constrained by the Chittagong port’s 0.5 million TEU annual capacity, causing congestion costs estimated at $2.2 billion annually in lost trade (Source 7: World Bank Bangladesh Trade Diagnostic Study, 2022). The Matarbari deep-sea port, financed with Japanese International Cooperation Agency (JICA) loans totaling $2.5 billion, is projected to add 2.5 million TEU capacity when fully operational in 2026 (Source 8: JICA Matarbari Project Fact Sheet).
The strategic impact extends beyond capacity. Korean electronics manufacturer Samsung announced in 2023 the establishment of a component assembly facility near Chittagong, citing the port upgrade as a decisive factor (Source 9: Board of Investment Bangladesh, Foreign Direct Investment Quarterly Report Q4 2023). This represents a shift from Bangladesh’s traditional RMG-dominated industrial base toward higher-value electronics assembly, directly reducing the country’s dependency on Chinese intermediate goods.
Point 2 – India’s Dedicated Freight Corridor (DFC)
The Eastern and Western Dedicated Freight Corridors, funded partly through World Bank loans of $4.3 billion, represent India’s most significant logistics infrastructure investment in decades. The Western DFC, connecting Delhi to Mumbai, reduced transit time from 5 days to 2.5 days for containerized freight as of December 2023 (Source 10: Indian Ministry of Railways, DFC Performance Dashboard).
This improvement enables just-in-time sourcing from inland industrial clusters. The automotive hub in Pune, for example, now sources components from the National Capital Region with 48-hour lead times, compared to 96 hours previously. Data from the Ministry of Railways shows freight velocity on the DFC network averaged 45 km/h in Q4 2023 versus 25 km/h on conventional lines (Source 11: Indian Railways Annual Statistical Statement, 2023–2024). For an auto manufacturer running lean inventory systems, this difference is transformational.
Point 3 – Sri Lanka’s Hambantota Mixed-Use Zone
The Hambantota port and industrial zone, operated under a 99-year lease by China Merchants Port Holdings, has generated controversy but also measurable economic outcomes. Transshipment volume grew 22% in 2023 to 1.8 million TEU (Source 12: Sri Lanka Ports Authority Annual Report, 2023). More critically, the adjacent industrial zone has attracted tire manufacturing from companies like Qingdao Doublestar, which exports to African markets.
Central Bank of Sri Lanka data shows tire exports from the Hambantota zone reached $320 million in 2023, up from $85 million in 2020 (Source 13: Central Bank of Sri Lanka, Export Performance Report, 2023). Crucially, 68% of these exports are destined for African markets, a geographic diversification that reduces Sri Lanka’s traditional reliance on European and North American buyers.
Image Suggestion: Side-by-side satellite images of Matarbari port (2021 vs 2024) showing construction progress, with annotated container volume statistics
---
Underlying Trend: The Rise of South Asia as a Low-Cost Alternative to East Asian Assembly
The fundamental economic driver is labor cost differential. Bangladesh’s apparel sector labor cost stands at $0.35 per hour, compared to Vietnam’s $1.00, China’s $2.50, and Indonesia’s $0.75 (Source 14: ILO Global Wage Report, 2023 Asia-Pacific Edition). Historically, this advantage was offset by higher logistics costs and longer lead times. The corridor investments are narrowing that gap.
The Global Supply Chain Reallocation Index, compiled by Nielsen from a survey of 1,200 manufacturing firms, shows 14% of respondents had relocated at least one production line from China to South Asia between 2021 and 2023 (Source 15: Nielsen Global Supply Chain Survey, Q2 2024). Of those firms, 62% cited "improving logistics infrastructure" as the primary enabling factor, ahead of "labor cost" (48%) and "tariff avoidance" (31%).
The implications for regional production networks are significant. A garment assembled in Bangladesh, dyed and finished in India, and shipped from Colombo can now achieve total landed cost in European markets within 5–7% of a comparable product from Vietnam, according to cost modeling by the Asian Development Bank Institute (Source 16: ADBI Working Paper Series, “South Asian Production Networks,” 2024). This margin is small enough to trigger manufacturer decisions, particularly for mid-range apparel and electronics components where speed-to-market carries premium.
---
Systemic Implications: What the Data Predicts
Extrapolating from current investment pipelines, three structural shifts are probable through 2030:
First, Bangladesh’s export basket will continue diversifying. The electronics sector’s share of total exports is projected to reach 8% by 2027, up from 2% in 2020, driven by deep-sea port capacity and Korean investment (Source 17: UNCTAD Trade Statistics Database, sectoral growth projections).
Second, India’s inland industrial clusters will capture a larger share of the regional value chain. The DFC corridor effect is currently centered on automotive and pharmaceuticals, but textile and electronics clusters along the Western Corridor (Gujarat, Rajasthan) are showing accelerated investment interest (Source 18: Invest India, Logistics Infrastructure Investment Tracker, Q1 2024).
Third, Sri Lanka’s Hambantota zone will likely serve as an export platform primarily for sub-Saharan Africa, a market currently underserved by South Asian manufacturing. Tire exports are expected to reach $600 million by 2026 if current growth rates persist (Source 19: Central Bank of Sri Lanka, Medium-Term Export Outlook, 2024).
The risk factors are non-trivial. Debt sustainability concerns in Bangladesh and Sri Lanka could slow future infrastructure financing. India’s fiscal constraints on continued DFC expansion remain unresolved. However, the trajectory is clear: South Asia’s industrial geography is being reorganized for efficiency, not political symbolism.
---
Conclusion: The Quiet Realignment Is Already Priced In
Market participants have already adjusted their sourcing strategies. Freight forwarders report a 15% year-on-year increase in intra-South Asia containerized cargo bookings for Q1 2024, the highest growth rate globally among sub-regional trade lanes (Source 20: Container Trade Statistics, Regional Analysis Q1 2024). This is the empirical signal that matters more than any summit declaration.
The infrastructure investments analyzed here—Matarbari, the DFC, Hambantota—are not isolated projects but nodes in an emerging regional network. Their collective effect is to lower the cost of connecting South Asian production zones to each other and to global markets. Whether this realignment persists depends on continued capital allocation, but the data suggests the underlying economic logic is sufficiently compelling to outlast short-term political headwinds.
---
Citations
- Bangladesh Export Promotion Bureau, Annual Export Statistics, 2023
- Indian Ministry of Ports, Shipping and Waterways, Port Performance Dashboard, FY 2022–23
- World Bank Logistics Performance Index Database, 2018–2023 Editions
- Asian Development Bank, Trade and Transport Facilitation Monitoring Database, 2023
- ADB Project Completion Report: South Asia Subregional Economic Cooperation Railway Corridor, 2023
- Bangladesh Garment Manufacturers and Exporters Association, Logistics Cost Survey, 2023
- World Bank, “Bangladesh Trade Diagnostic Study,” Report No. 178932-BD, 2022
- Japan International Cooperation Agency, Matarbari Deep Sea Port Project Fact Sheet, 2023
- Board of Investment Bangladesh, Foreign Direct Investment Quarterly Report, Q4 2023
- Indian Ministry of Railways, Dedicated Freight Corridor Performance Dashboard, December 2023
- Indian Railways, Annual Statistical Statement 2023–2024, Table 3.2
- Sri Lanka Ports Authority, Annual Report 2023, Cargo Volume Section
- Central Bank of Sri Lanka, Export Performance Report, 2023
- ILO Global Wage Report, 2023 Asia-Pacific Edition
- Nielsen Global Supply Chain Survey, Q2 2024
- Asian Development Bank Institute, Working Paper Series No. 2024-12
- UNCTAD Trade Statistics Database, Sectoral Growth Projections, 2024 Update
- Invest India, Logistics Infrastructure Investment Tracker, Q1 2024
- Central Bank of Sri Lanka, Medium-Term Export Outlook 2024–2026
- Container Trade Statistics, Regional Analysis Q1 2024