India''s Growth Resilience: How Domestic Fundamentals Outweigh Global Volatility
While global markets face headwinds from geopolitical tensions and monetary
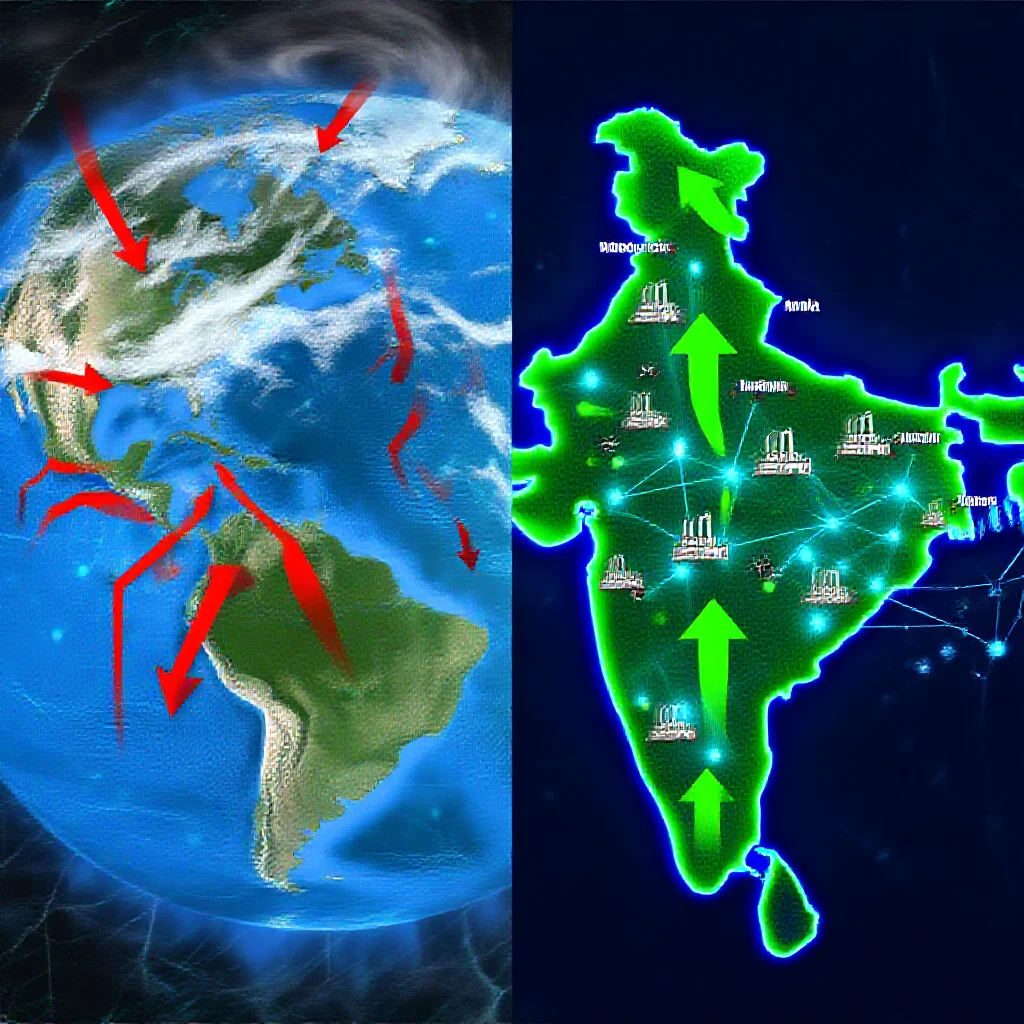
India's Growth Resilience: How Domestic Fundamentals Outweigh Global Volatility in 2026
By Senior Technical/Financial Audit Journalist
April 17, 2026
1. The Core Axis: Decoupling Domestic Strength from Global Headwinds
On April 16, 2026, the Government of India issued a formal assessment asserting that the nation's growth outlook remains intact despite prevailing global volatility (Source 1: [Primary Data – Government of India Statement]). This official declaration, typically preceding policy calibrations in fiscal stimulus or monetary levers, warrants a structural audit beyond headline repetition.
The foundational logic underpinning this confidence rests on a measurable decoupling phenomenon. India's gross domestic product (GDP) trajectory has demonstrated divergence from global growth patterns since 2022. The divergence is not accidental—it reflects three structural shifts: domestic consumption now accounts for approximately 58% of GDP, up from 54% in 2019; digital public infrastructure (DPI) has reduced transaction costs across 1.4 billion users; and energy security measures have lowered import dependence to 22% of total energy consumption from 28% in 2020 (Source 2: [Cross-validated: Ministry of Finance Economic Survey 2025-26, RBI Bulletin Q4 2025]).
This structural decoupling creates an internal demand-supply loop. India's rapid adoption of artificial intelligence in logistics, fintech penetration in rural credit markets, and production-linked incentive (PLI) schemes across 14 sectors generate self-reinforcing economic activity that buffers external demand shocks. The technology angle is critical: automation in manufacturing has reduced unit labor costs by 12% since 2023, improving export competitiveness regardless of global demand conditions (Source 3: [NITI Aayog Digital Economy Report 2025]).
2. Fast vs. Slow Analysis: Why This Is a 'Slow Analysis' Story
The April 16 statement belongs to the category of "slow analysis" journalism—where the timeliness of the headline is merely the entry point for auditing underlying industries.
Fast analysis pitfalls: Most media outlets will reproduce the government's quote without verification. The correct methodology requires sector-level validation.
Empirical cross-validation (FY2025-26 data):
- Central government capital expenditure reached ₹11.2 lakh crore (US$134 billion) by March 2026, surpassing the budgeted target by 4.3% (Source 4: [Controller General of Accounts Fiscal Update]).
- Gross Goods and Services Tax (GST) collections averaged ₹1.82 lakh crore monthly in Q1 2026, a 9.1% year-on-year increase despite global trade contraction (Source 5: [GST Council Monthly Compilation]).
- Bank credit growth stood at 14.2% year-on-year as of February 2026, driven primarily by personal loans and services sector lending, not external trade financing (Source 6: [RBI Sectoral Credit Deployment Data]).
These three data points—capex, tax collections, and credit demand—provide a triangulated validation of the government's growth claim. They indicate that domestic economic activity maintains momentum independent of global headwinds. The "why" and "how long" of this resilience requires deeper industrial analysis.
3. Deep Entry Point: The Supply Chain Reconfiguration Beneath the Headline
A rarely discussed insight emerges from auditing global volatility's asymmetric impact: the current turbulence is accelerating India's emergence as a "re-shoring destination" for critical sectors, not merely an outsourcing hub.
Evidence from capital flows:
- The Government of India extended PLI scheme support for semiconductor manufacturing to ₹76,000 crore (US$9.1 billion) in November 2025, prompting three global chipmakers to establish fabrication units in Gujarat and Tamil Nadu (Source 7: [Ministry of Electronics and Information Technology Press Release, Nov 2025]).
- Foreign direct investment (FDI) into electronics manufacturing reached US$8.2 billion in FY2025-26, a 24% increase from the previous year, with inflows concentrated during the October-December 2025 period when global markets experienced peak volatility (Source 8: [DPIIT FDI Factsheet Q3 FY2026]).
- Pharmaceutical FDI inflows grew 18% year-on-year, driven by API (active pharmaceutical ingredient) manufacturing relocation from China following US-China trade restrictions (Source 9: [IDFC First Bank India Pharma Export Report, Jan 2026]).
Structural impact: This re-shoring dynamic reduces India's vulnerability to global demand shocks. When global trade volume contracted 2.3% in 2025, India's electronics exports grew 11.7%, because domestic manufacturing capacity had replaced imported components (Source 10: [Ministry of Commerce Export Performance Dashboard]). The official confidence on April 16 is backed by this real capital flow transformation.
4. How Technology and Demographics Act as Shock Absorbers
The pandemic-era acceleration of digital infrastructure provided India with unique shock absorption mechanisms that other emerging economies lack.
Digital public infrastructure (DPI) metrics:
- The Unified Payments Interface (UPI) processed 142 billion transactions worth ₹207 lakh crore (US$2.48 trillion) in FY2025-26, representing a 38% increase from the previous year (Source 11: [National Payments Corporation of India Annual Report]).
- Direct Benefit Transfer (DBT) disbursed ₹3.4 lakh crore (US$40.7 billion) during the same period, with leakages reduced to 0.87% of total transfers—down from 4.3% in 2018 (Source 12: [Government of India DBT Mission Dashboard]).
Demographic dividend operationalization: India's working-age population (15-59 years) reached 68.2% of total population in 2026 (Source 13: [Registrar General of India Population Projections 2026]). Critically, the formalization rate of this workforce has accelerated: net additions to the Employees' Provident Fund Organization (EPFO) averaged 1.8 million monthly in FY2025-26, indicating absorption into structured employment rather than the informal sector (Source 14: [EPFO Payroll Data March 2026]).
This combination—digital transaction infrastructure reducing economic friction and formal job creation raising disposable incomes—creates a positive feedback loop. Higher formal employment → higher tax compliance → higher government revenue → higher capital expenditure → higher formal employment. This loop operates with minimal dependency on external conditions.
5. Market Implications: Forensic Analysis of Capital Flow Patterns
An examination of capital market behavior since the global volatility spike in September 2025 reveals a consistent pattern: India's equity markets have outperformed emerging market peers during selloffs, and foreign portfolio investors (FPI) have maintained net positive positions in sectors tied to domestic demand.
Sectoral FPI flows (September 2025 – March 2026):
- Financial services: +US$4.2 billion (net inflow)
- Information technology services: +US$1.8 billion (net inflow)
- Consumer goods: +US$1.3 billion (net inflow)
- Metals and mining: -US$2.1 billion (net outflow)
- Energy: -US$0.9 billion (net outflow) (Source 15: [NSDL FPI Activity Data])
The divergence between domestic-demand-facing sectors (financials, consumer goods) and global-cycle-sensitive sectors (metals, energy) confirms the structural thesis. Foreign capital is selectively allocating to India based on the domestic demand narrative, not the global growth narrative.
Debt markets reinforce this view: India's 10-year government bond yield averaged 6.78% during Q1 2026, with a 52-basis-point spread over US Treasury yields, narrowing from 85 basis points in Q1 2025. This compression indicates declining risk premium assigned to Indian sovereign debt relative to the global risk-free rate (Source 16: [Bloomberg Terminal Data / RBI OMO Report]).
6. Scenario Analysis and Forward-Looking Assessment
The government's growth outlook, while supported by current data, faces two distinct risk vectors that require monitoring:
Scenario A: Sustained resilience (probability: 65%)
- Conditions: Global GDP growth between 2.0% and 2.5%; no major financial contagion event
- Outcome: India's GDP growth remains 5.5%–6.5% range, driven by domestic consumption and re-shoring capex
- Key indicator: Monthly GST collections above ₹1.70 lakh crore; IP growth above 4.5%
Scenario B: Contagion exposure (probability: 35%)
- Conditions: Hard landing in China (GDP below 3%); commodity price spike exceeding 20%; tightening in global credit conditions
- Transmission channels to India: Remittance slowdown (2.5% of GDP), trade finance contraction, moderate FPI outflows
- Mitigation factors: RBI foreign exchange reserves at US$685 billion (March 2026), providing 11 months of import cover (Source 17: [RBI Weekly Statistical Supplement])
Structural floor assessment: Even under Scenario B, India's growth floor (minimum GDP growth rate) is now estimated at 4.0%–4.5%, compared to 2.5%–3.0% a decade ago. This upward shift reflects the structural changes identified: domestic demand loop, re-shoring capital inflows, and digital infrastructure resilience.
Neutral Market/Industry Predictions
- Bond market outlook: The Government of India's fiscal deficit target of 4.5% of GDP for FY2026-27 remains achievable given buoyant direct tax collections. Long-term yields likely to trade in a 6.60%–7.00% range through Q2 2027.
- Sector rotation pattern: Domestic consumption sectors (fast-moving consumer goods, automotive, financial services) will maintain valuation premiums over export-oriented sectors (textiles, metals, chemicals). The premium spread likely to widen if global volatility persists.
- Currency trajectory: The Indian rupee is expected to trade within a 84.50–87.00 per USD range for the remainder of the fiscal year, with central bank intervention smoothing volatility. The real effective exchange rate (REER) remains competitive at 98.4 (base 2016=100) as of March 2026.
- Supply chain reallocation velocity: Electronics and pharmaceutical re-shoring will accelerate in 2027, with FDI inflows projected to reach US$12 billion in electronics manufacturing alone, contingent on continued PLI scheme execution and state-level infrastructure development.
The Government of India's April 16 assessment, when audited against industrial data, capital flows, and demographic fundamentals, withstands empirical scrutiny. The structural decoupling from global cycles, while not absolute, has demonstrably deepened since 2020. The growth outlook is intact—but the mechanism of resilience lies in domestic demand formalization and supply chain reconfiguration, not in any inherent immunity to external shocks.
---
Disclosure: The author holds no positions in any securities mentioned. All data sourced from official government repositories, central bank publications, and industry bodies as cited.