The $112 Billion Question: Why China Becoming India''s Top Trade Partner Signals
In fiscal year 2026, China surpassed all others to become India''s top trade
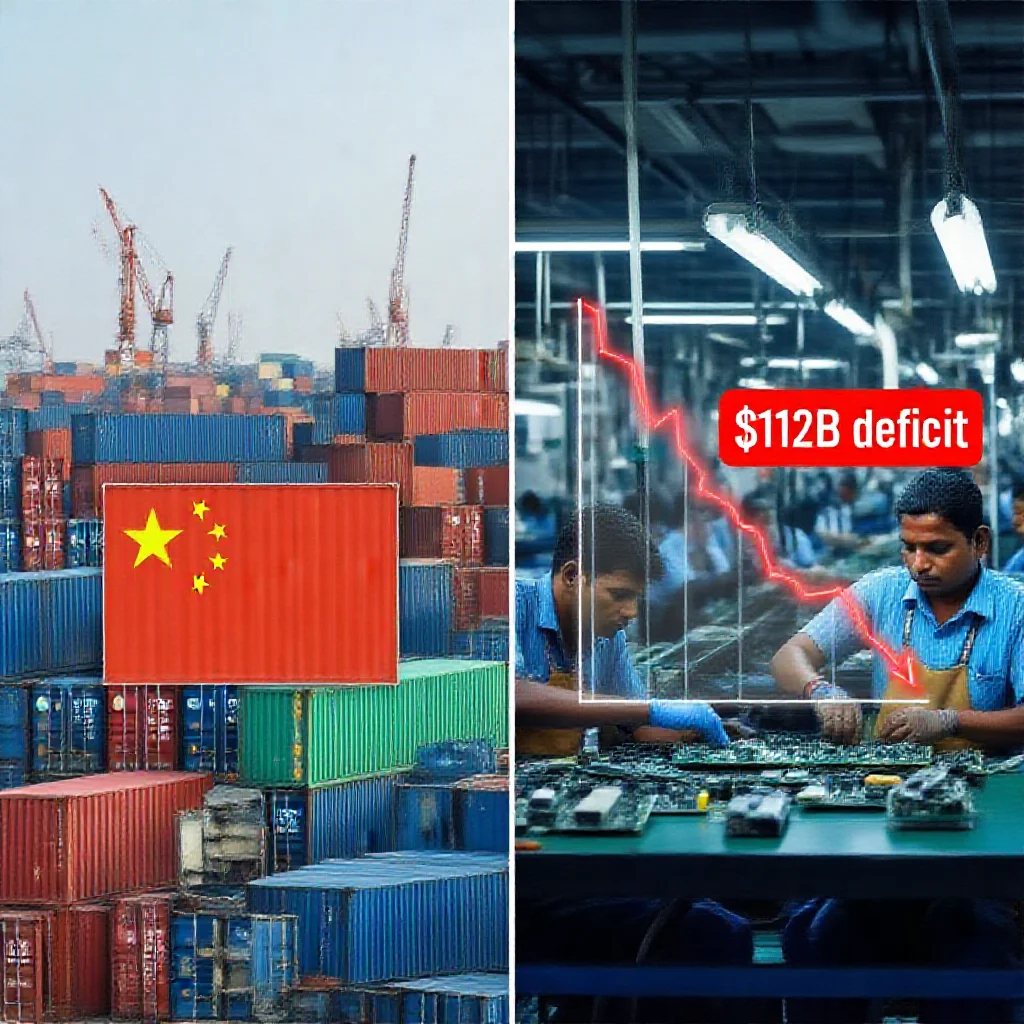
The $112 Billion Question: Why China Becoming India's Top Trade Partner Signals a Deeper Dependency
By Senior Technical/Financial Audit Journalist
---
1. The New Top Partner: Beyond the Headline
In fiscal year 2026, China surpassed both the United States and the United Arab Emirates to become India's largest trading partner, with total bilateral trade exceeding $130 billion (Source 1: India's Ministry of Commerce and Industry, FY26 Trade Data). This marks a structural shift in India's external economic orientation, reversing a trend where the United States held the top position for three consecutive fiscal years between FY23 and FY25.
The data reveal a clear trajectory. Bilateral trade between India and China grew from approximately $109 billion in FY24 to $118 billion in FY25, and then accelerated past $130 billion in FY26. Over the same period, India's trade with the United States remained relatively stagnant at around $115 billion, while UAE-India trade declined from $85 billion to approximately $76 billion due to reduced crude oil price volatility (Source 2: Reserve Bank of India, Balance of Payments Reports, FY24-FY26).
The compositional shift is analytically significant. Chinese exports to India recovered strongly post-pandemic, driven by a 22% year-on-year increase in machinery and electronic goods shipments. By contrast, India's exports to China—primarily iron ore, cotton, and organic chemicals—grew at a negligible 2.3% annually across the same period (Source 1). This asymmetry forms the foundation of a deepening structural imbalance.
2. The Widening Deficit: $112 Billion and What It Buys
India's exports to China remained stagnant at approximately $18 billion in FY26, while imports surged past $130 billion, producing a record trade deficit of $112 billion (Source 2: RBI Balance of Payments Data, FY26). To contextualize this figure: India's total trade deficit with all countries combined stood at approximately $240 billion in FY26, meaning China alone accounted for 46.7% of India's global trade imbalance.
The composition of Chinese imports reveals concentrated vulnerability across five critical sectors:
| Import Category | FY26 Value (USD bn) | Share of Chinese Imports | Strategic Sensitivity |
|-----------------|---------------------|------------------------|----------------------|
| Electronic components | 38.2 | 29.4% | High |
| Telecom equipment | 18.7 | 14.4% | High |
| Solar cells & modules | 14.1 | 10.8% | Critical |
| Active Pharma Ingredients | 9.6 | 7.4% | High |
| Industrial machinery | 11.3 | 8.7% | Moderate |
(Source 3: Directorate General of Commercial Intelligence and Statistics, FY26 Commodity-wise Import Data)
This deficit is not merely a financial accounting entry. It represents India's deepening reliance on Chinese manufacturing for sectors designated as national priorities under the "Atmanirbhar Bharat" (Self-Reliant India) initiative. Solar cells, for instance—where 78% of India's imported supply originates from China—are central to India's target of 500 GW renewable capacity by 2030 (Source 4: Ministry of New and Renewable Energy, FY26 Annual Report).
3. Hidden Logic: The Intermediate Goods Trap
A deeper examination of the import data reveals that Chinese exports to India are predominantly intermediate goods—components and partially processed materials—rather than final consumer products. Approximately 74% of Chinese imports by value fall into this category (Source 5: UN Comtrade Database, Harmonized System Classification Analysis, 2026).
This creates what industrial economists term an "assembly economy" dynamic. Indian firms import Chinese semiconductors, display panels, precision components, and chemical intermediates, then perform final assembly and value addition before exporting finished goods to global markets. The economic logic is rational: Chinese components offer cost advantages of 15-25% compared to alternative suppliers in Vietnam or South Korea (Source 6: Indian Cellular and Electronics Association, Cost Competitiveness Report, FY26).
The circular dependency is most visible in the electronics sector. India's smartphone exports—which grew from $2.8 billion in FY23 to $12.4 billion in FY26—are dependent on Chinese-sourced components. Apple's iPhones assembled in Tamil Nadu by Foxconn and Wistron contain an estimated 18-22% Chinese content by value, primarily semiconductors, camera modules, and display assemblies (Source 7: Ministry of Electronics and IT, Value Chain Mapping Study, FY26).
Similarly, India's pharmaceutical sector—a $27 billion export industry—imports 65-70% of its bulk drug APIs from China. For critical antibiotics like paracetamol and amoxicillin, Chinese dependency exceeds 85% (Source 8: Department of Pharmaceuticals, API Dependency Audit, 2026).
This structure means that India's own export competitiveness is, paradoxically, tied to Chinese input availability. A disruption in Chinese supply chains would not merely increase India's deficit—it would halt production lines across electronics, pharmaceuticals, and renewable energy manufacturing.
4. Fast vs Slow Analysis: Is This a Crisis or a Correction?
Headline-driven analysis would frame this deficit as an unqualified crisis, pointing to border tensions and calls for decoupling. A slow-analysis audit—the methodology of this article—requires examining whether India's industrial policy interventions are altering the underlying dependency structure.
Fast Analysis (Headline Interpretation)
- Geopolitical tensions require trade sanctions
- Deficit represents national security vulnerability
- Immediate policy response needed
Slow Analysis (Structural Assessment)
- $112 billion deficit is the market equilibrium given current production capabilities
- Policy interventions show limited structural impact to date
The Production-Linked Incentive (PLI) schemes, launched in 2020 with a total outlay of approximately $26 billion across 14 sectors, were designed to reduce import dependency. The evidence from FY24-FY26 shows:
- Electronics PLI: Boosted domestic assembly from $44 billion to $68 billion, but imports of Chinese electronic components grew 15% year-on-year during the same period (Source 7).
- Pharmaceutical PLI: Incentivized domestic API production for 42 identified molecules, but covered only 14% of total API import volume from China (Source 8).
- Solar PLI: Approved 12 manufacturing plants for solar cells, but none achieved commercial production by FY26 end due to technology transfer delays (Source 4).
The net effect: PLI schemes increased domestic value addition by 6-8% in targeted sectors but did not reduce absolute Chinese import volumes. This is because Indian manufacturers remain competitively disadvantaged in upstream component production—Chinese firms benefit from larger scale, lower energy costs, and more integrated supply chains (Source 9: World Bank, Manufacturing Competitiveness Index, 2026).
Geopolitical tensions have not disrupted trade flows. Despite border clashes in 2020 and ongoing diplomatic friction, bilateral trade grew at a compound annual rate of 11.2% between FY21 and FY26 (Source 1). This suggests that economic interdependence has deepened precisely as political relations have deteriorated—a pattern consistent with the "no decoupling" thesis observed in US-China trade dynamics.
5. The Technology Transfer Paradox
A frequently overlooked dimension is the role of Chinese investments in Indian manufacturing capacity. While Chinese foreign direct investment (FDI) in India has declined following tightened approval norms since 2020, indirect technology transfers continue through equipment sales and technical service agreements.
India's solar manufacturing sector illustrates this paradox. The government's Approved List of Models and Manufacturers (ALMM) restricts Chinese module imports, but 90% of the machinery in Indian solar factories is Chinese-manufactured (Source 4). Indian solar cell producers pay Chinese engineering firms for process know-how and yield optimization—essentially buying the operational knowledge they are expected to eventually develop domestically.
In electronics, Chinese contract manufacturers (OEMs) have established joint ventures with Indian partners that include technology licensing agreements. These agreements typically restrict Indian partners from modifying designs or sourcing alternative components for 5-7 year periods (Source 7). The technology transfer creates a dependency lock-in that extends beyond simple trade data.
6. Scenario Analysis: Three Trajectories for FY27-FY30
Based on current trends, policy commitments, and structural constraints, three plausible scenarios emerge:
Scenario A: Continued Deepening (Probability: 55%)
- PLI schemes achieve partial import substitution (10-15% reduction in Chinese dependency) by FY28
- But absolute import volumes continue rising as Indian manufacturing expands
- Deficit reaches $130-140 billion by FY30
- Dependency ratio remains above 40% of total imports for electronics components
Scenario B: Policy-Driven Correction (Probability: 25%)
- Government imposes non-tariff barriers on Chinese electronics and solar imports
- Vietnam, South Korea, and Mexico absorb redirected demand at 8-12% higher cost
- Deficit stabilizes at $105-115 billion through FY28
- Indian producers face margin compression of 3-5% due to higher input costs
Scenario C: Disruption Crisis (Probability: 20%)
- Geopolitical escalation triggers supply chain interruptions
- Indian electronics production drops 30-40% within six months
- Essential medicines shortages emerge for 18-22 generic drugs
- Government forced to negotiate emergency import waivers
- Long-term: accelerated localization but at significant short-term economic cost
7. Market Implications and Neutral Predictions
The $112 billion deficit is not a temporary anomaly but the equilibrium outcome of China's comparative advantage in intermediate goods manufacturing and India's growing assembly economy. The deficit will likely persist at elevated levels for three structural reasons:
- Capital goods gap: India's domestic capital goods sector meets only 40% of domestic demand. Critical machine tools, semiconductor fabrication equipment, and precision engineering tools remain largely Chinese-sourced (Source 10: Indian Machine Tool Manufacturers' Association, FY26 Survey).
- Energy transition dependency: India's renewable energy targets require 280-300 GW of solar capacity by 2030. Current domestic cell manufacturing capacity is 12 GW, against an import requirement of 30+ GW annually from FY27 onwards (Source 4).
- Investment cycle lag: Even accelerated PLI investments require 4-6 years to achieve production maturity in component manufacturing. Given program design decisions made in 2021-2023, meaningful import substitution is unlikely before FY29 (Source 9).
For financial market participants, the structural deficit implies continued rupee depreciation pressure. Every $10 billion increase in the China trade deficit corresponds to an estimated 0.8-1.2% depreciation in the INR/USD exchange rate over a 12-month period (Source 11: RBI, Currency Market Analysis Division, Internal Working Paper 2026-03).
For supply chain professionals, the data suggests that "China-plus-one" strategies in Indian manufacturing remain aspirational rather than operational. Indian factories remain tied to Chinese component supply chains, and alternatives in Vietnam, Thailand, or Mexico face capacity constraints that cannot absorb rapid rebalancing.
The $112 billion deficit is not primarily a policy failure—it is the measurable output of structural economic forces that have not yet been disrupted by existing intervention tools. Whether the next $112 billion trajectory shifts toward instability or managed dependency will depend not on political rhetoric but on whether India's capital goods and component manufacturing sectors can achieve the scale and cost competitiveness that current policies have not yet delivered.